Normalizing ZET Deployments: Why It Matters
By Jacob Richard
February 10, 2026
In the January 2026 Zeroing in on Zero-Emission Trucks (ZIO ZET) report, we noted more than 59,000 ZETs operating on U.S. roadways as of June 2025. While most of these deployments are in California (approximately 10,659), 18 states have at least 1,000 ZET deployments, showcasing widespread adoption.
In every ZIO ZET report, our team finds that the states with the largest truck stock populations have the most ZET deployments. This correlation makes sense, but it prevents us from seeing whether states with smaller truck stock populations are also making progress.
This is where normalizing ZET deployments comes in: examining the ZET market share in each state and controlling vehicle stock and segment. By looking at ZET deployments relative to each state’s truck market and separating those deployments into different segments, we gain a better understanding of which states are truly accelerating the transition to zero-emission freight. For example, Utah has approximately 143,014 commercial vehicles — and Texas has 10 times that. We can assume, based on those numbers, that Utah will most likely never have more ZETs than Texas. But, relative to their market size, Utah is outperforming Texas, with a normalized score of .27, better than Texas’s .2. Utah is even ranked tenth for normalized ZET score. Because we’ve normalized both states’ deployments, we now have an opportunity to examine Utah’s significant zero-emission vehicle growth, learn from their progress, and figure out how to apply their market acceleration techniques in other states.
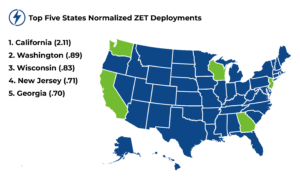
Normalization doesn’t just provide a deeper dive into ZET deployment numbers; it offers a wider perspective on which states are accelerating progress. This wider perspective is exemplified by the fact that the top five states in normalized score differ from the top five states with the most absolute deployments. California, Washington, Wisconsin, New Jersey, and Georgia are the top five in terms of normalized score, meaning these states are performing best relative to the national average and therefore have accelerated ZET adoption the most.
Another example of normalization’s impact is Texas and Florida, which are second and third, respectively, in terms of ZET deployments. However, when those deployments are normalized, Texas shifts to eleventh and Florida to thirty-fourth. It’s a more nuanced picture, one that shows these states aren’t as ahead as they initially appeared. Examining the deployments further, we find that both states have large cargo van populations, which have fewer barriers to adoption. This shows that Texas and Florida are not deploying a wide variety of ZETs and instead have a high number of zero-emission cargo van deployments. Normalization provides a clearer picture beyond absolute ZET deployment numbers, showing that work in these states is still needed to accelerate adoption.
On the other hand, Washington, Wisconsin, and Georgia, all states that fall outside the top five in cumulative ZET deployments, appear in the top five for normalized ZET score. Each state differs in adoption strategies, but all three are showing success. Washington has the most favorable economics for ZET deployment in the United States, meaning they have the greatest delta between diesel and electricity costs, so adoption makes more sense for businesses in the state. Coupled with incentives, regulations, and innovative polices to encourage adoption, Washington has punched above its weight in terms of getting ZETs on the road. Additionally, Wisconsin has seen a strong public sector commitment to ZETs, including multiple zero-emission refuse trucks operating in the state.
Georgia, however, has gone in a different direction. The state is using strong economic development policies — such as a business development strategy with a strong ZET cluster focus that includes component and battery manufacturing — to lure billions of dollars in clean energy investments to the state. The fact that ZETs are being manufactured in the state also doesn’t hurt: Hyundai already uses 21 zero-emission heavy-duty trucks at their Georgia plant. Those 21 trucks alone are more than the total zero-emission heavy-duty truck deployments in 33 other states and help make Georgia number 5 in normalized ZET score.
In summary, normalized scores allow us to more accurately understand which states are accelerating ZET adoption, resulting in more clarity for stakeholders across the country. Policymakers can better pinpoint states to learn from to advance zero-emission deployments at home. Original equipment manufacturers can more effectively see which states are more likely to have fleets interested in buying ZETs. And charge point operators have a better sense of where to focus future sites, knowing certain states have more favorable landscapes.
As the market for ZETs matures, it will be increasingly important to understand not only the quantity of ZET deployments, but their penetration as well. Highlighting and learning from states with the highest normalized ZET score is crucial for continuing to accelerate ZET adoption across the United States.
Access the full ZIO ZET update here.
Jacob Richard is a technical project manager on the Trucks team at CALSTART and author of the new Zeroing in on Zero-Emission Trucks market update.